Editing Graphs and Templates
Edit a Graph
Section titled “Edit a Graph”When you click the Edit Graph button, a new window will open with options to Edit Basic Information, Edit Data Accomplishments, Add Additional Data, Format Graph, and Add Comparison Graph. Click the category you want to edit, and then type in the new information.
Edit Basic Information
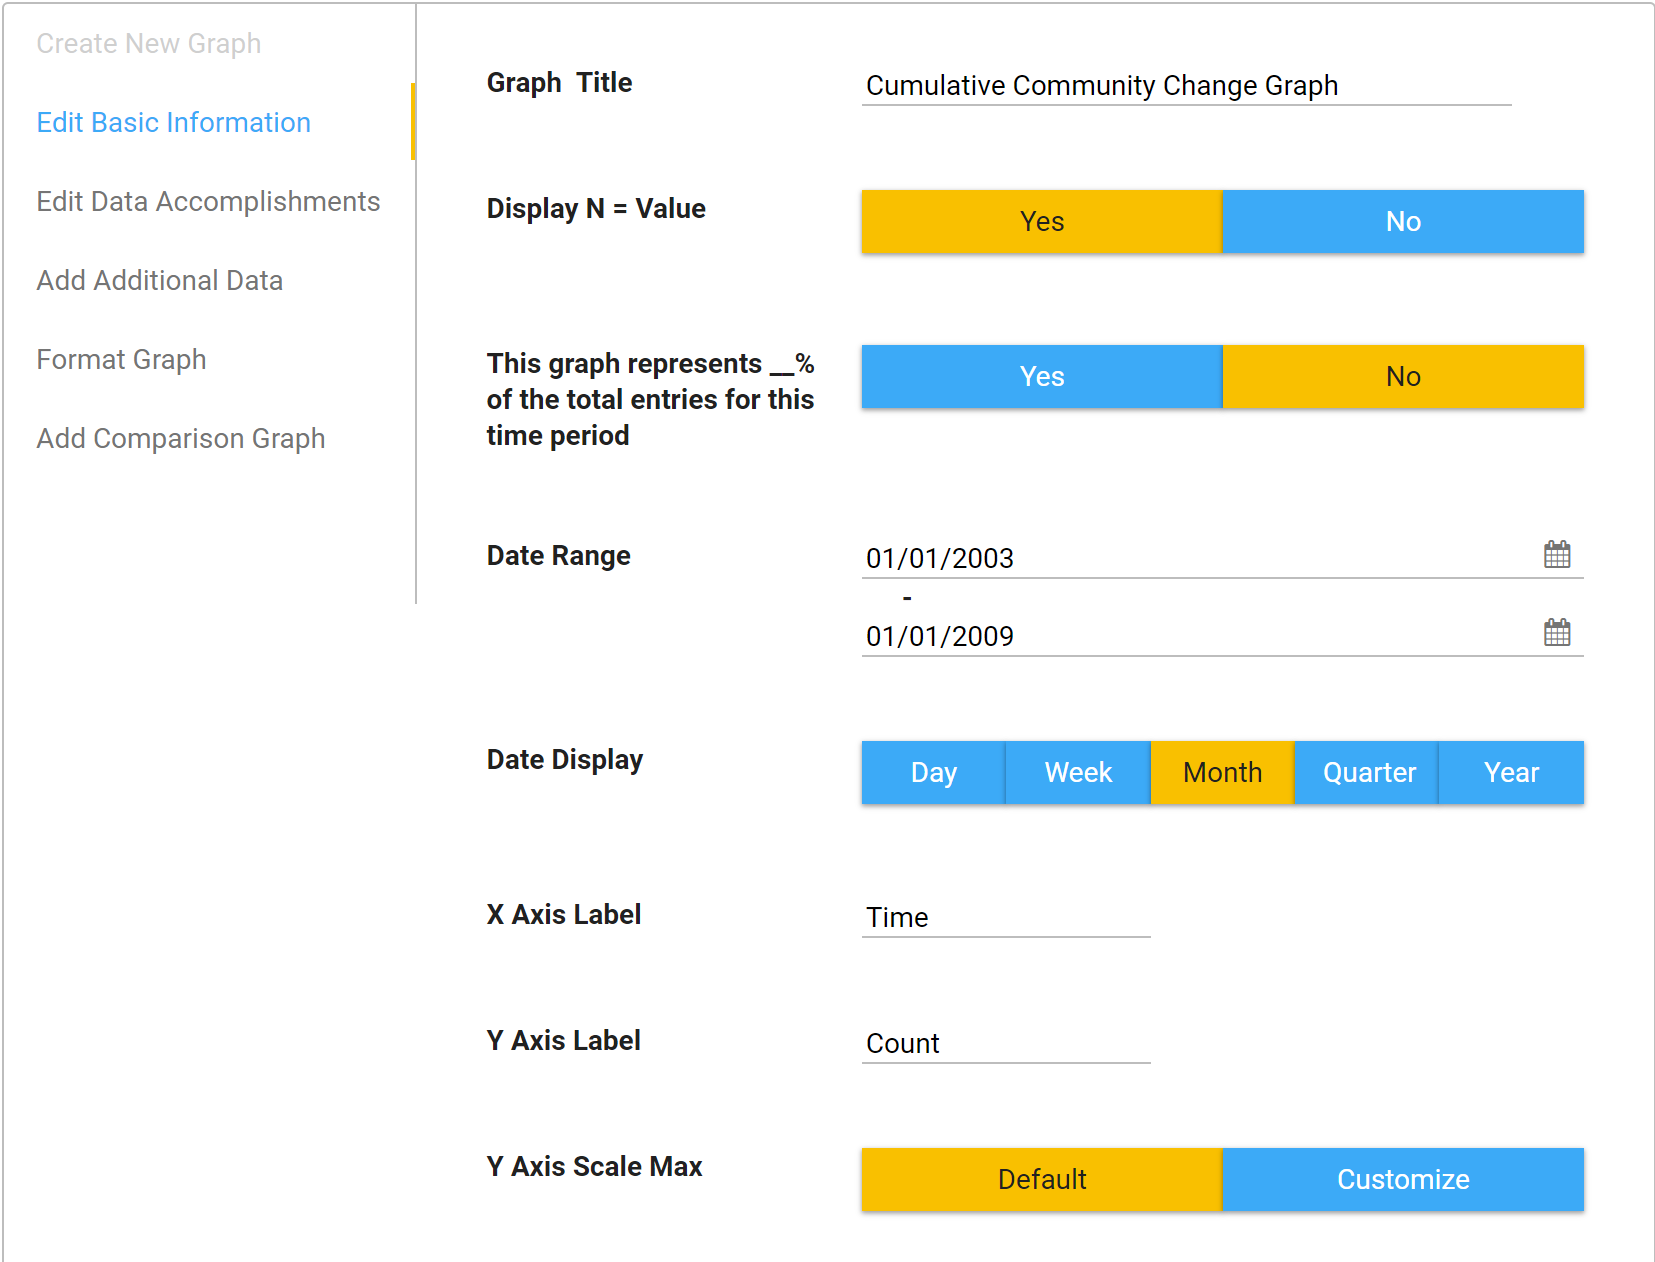
Section titled “Edit Basic Information”- Title: Update the title of the graph.
- Date Range: Adjust the range of data displayed by changing the dates shown. Note: the Date Range defaults to the current calendar year.
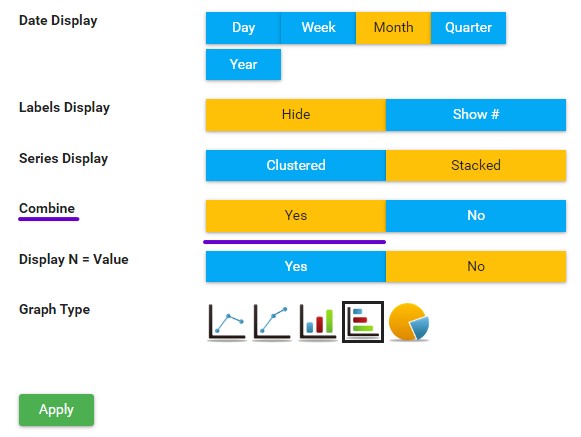
- Date Display: To review a broader or narrower view of data points throughout your date range, you can change the Date Display to reflect points by Day, Month, Quarter, or Year.
- X and Y Axis Label: Update the label for the X Axis and Y Axis as needed. If you want to remove the X and Y axis labels, leave them blank.
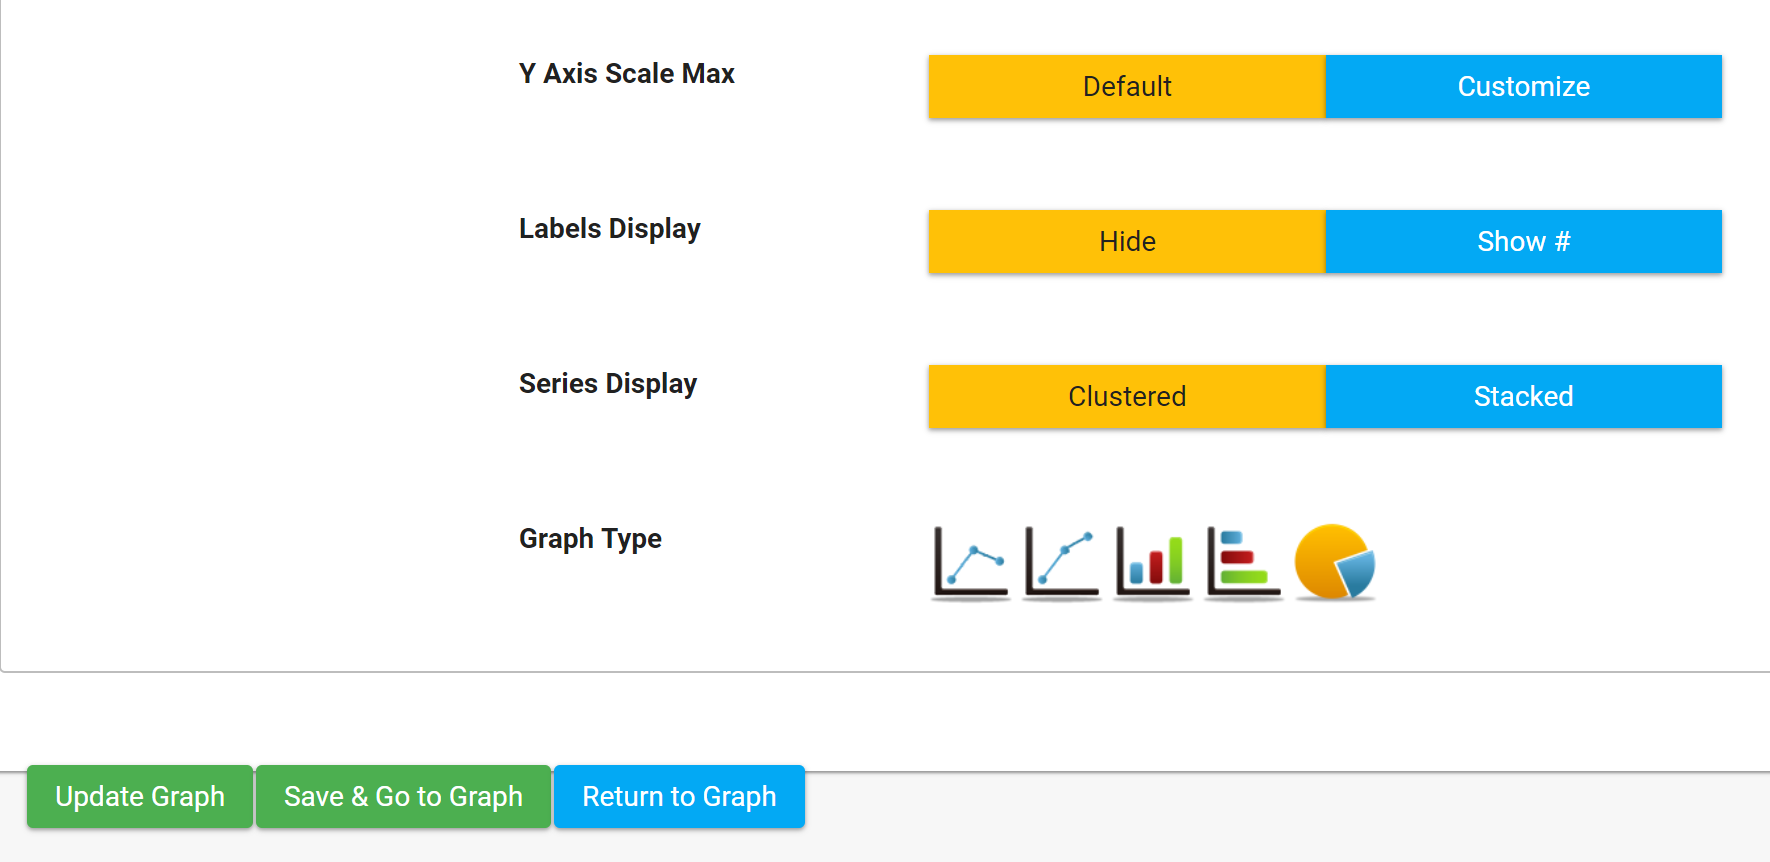
- Labels Display: Click Show # to display the data labels on the graph, or Hide to keep them hidden.
- Series Display: Click Stacked or Clustered depending on how you want to view your data.
- Graph Type: If you would like to view varying presentations of the data, you can modify the graph type by selecting from the Graph Type icons.
When you are done making changes on this page, click:
- Update Graph if you want to save and stay on this page.
- Save & Go to Graph if you want to save and go back to the graph.
- Return to Graph if you do not want to save changes.
Edit Data Accomplishments
Section titled “Edit Data Accomplishments”-
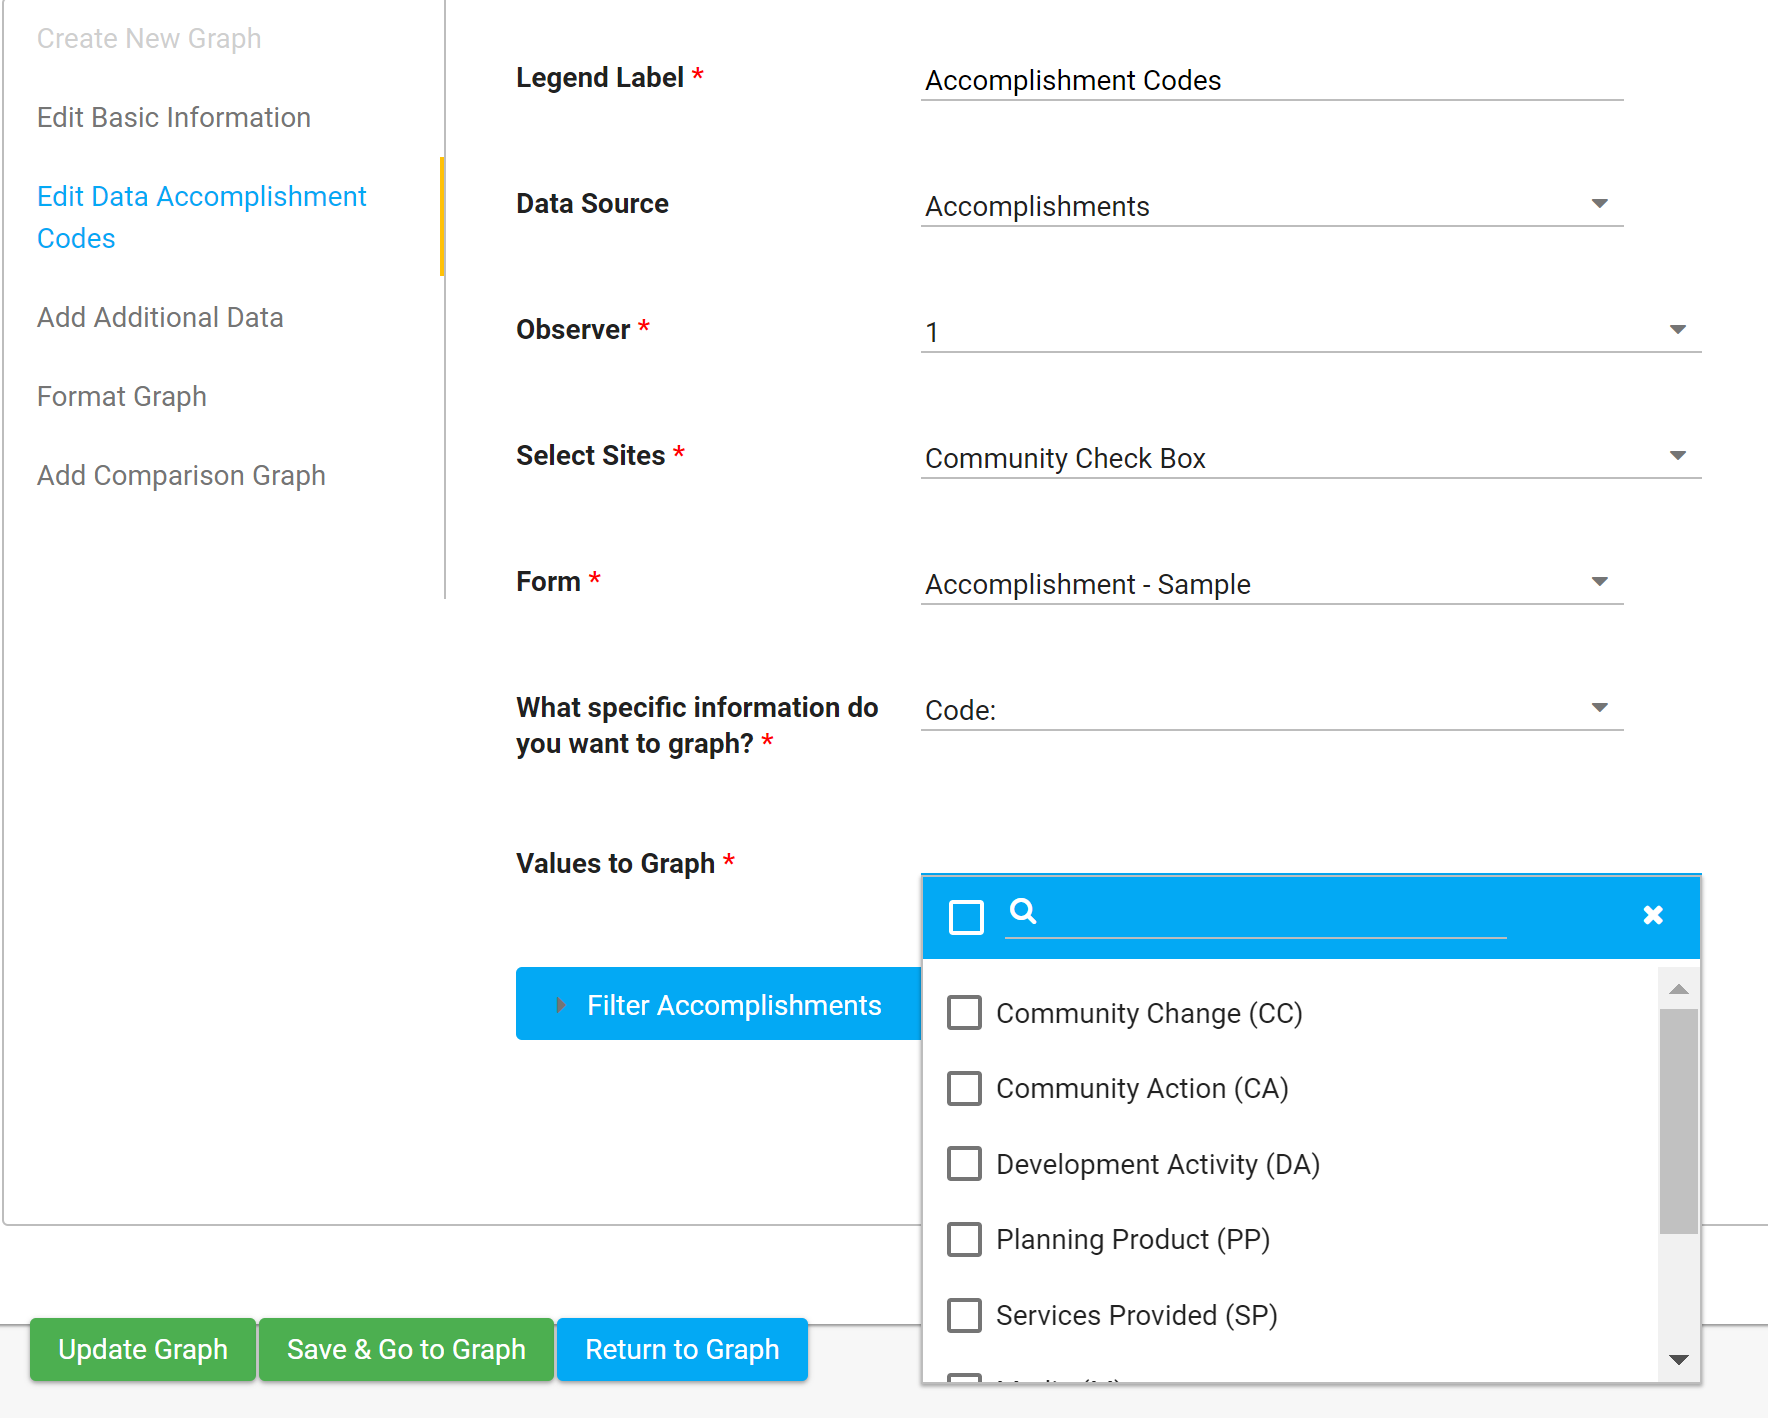
Legend Label: Will default to the name of the data being graphed (e.g., Accomplishments), but you can change if needed. Legend field names should not be more than 30 characters to display correctly on the graph.
-
Data Source: This is the source of your data (e.g., Accomplishments, Indicators, etc.).
-
Observer: Select this if you want to select data from a particular observer.
- Observer 1: Primary Data (where all initial data should be entered)
- Observer 2: Reliability Scorer Data (Secondary Scoring)
- Observer 3: Calibration Scorer Data (Tertiary Scoring)
-
Select Sites: If you have multiple CCBs within your site collection, select the site(s) you want to graph.
-
Form: If you have multiple forms within your CCB, select the form you want to graph.
-
What specific information do you want to graph? Select the specific question you want to graph.
-
Values to graph: Example: if you select Code in the previous field, then you can select which codes to include in this field. The default is for all responses to be included, but you can edit that to one or more specific responses.
-
Filter Accomplishments: If you want to apply filters, then select them here. If you don’t see a specific question available to filter, please enable Apply Filter on the form’s question under Administration.
Generally, all dropdown, multiselect, numerical, and date fields are graphable and filterable. Text boxes and text lines are not, due to many variations in spelling, punctuation, etc.
When you are finished making changes, click Update Graph, Save & Go to Graph, or Return to Graph.
Add Additional Data
Section titled “Add Additional Data”You can select from various data sources on your site to include additional data in your graph.
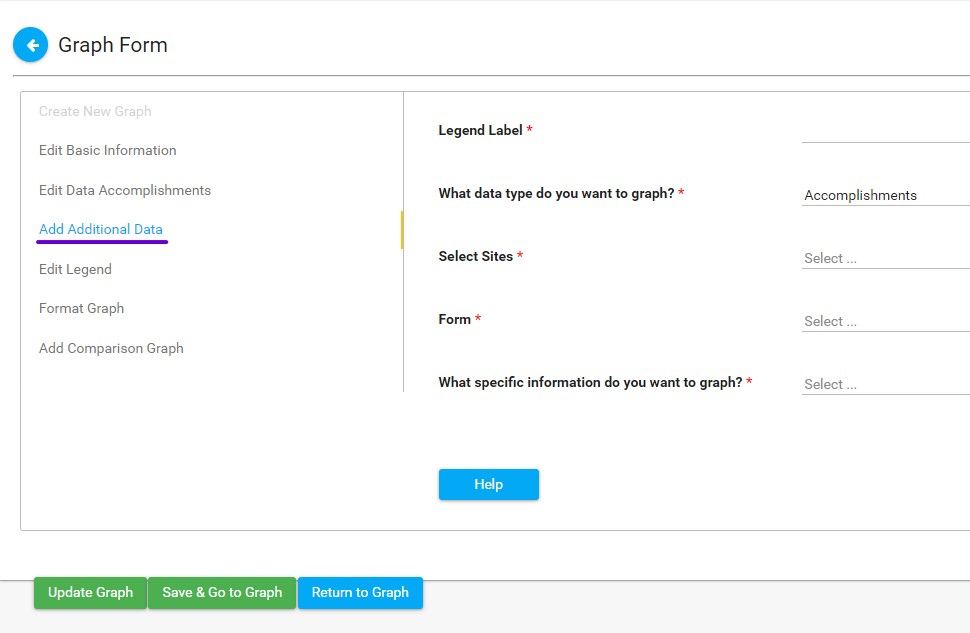
- Legend Label: Will default to the name of the data being graphed (e.g., Accomplishments, Participants Description, Indicators), but you can change if needed. Legend field names should not be more than 30 characters to display correctly and legibly on the graph.
- What data type do you want to graph? Select the data type (e.g., Accomplishments, Participants Description, Indicators).
- Select Sites: If you have multiple CCBs in your site collection, select which CCB you want to graph.
- Form: If you have multiple forms within the CCB, select which form you want to graph.
- What specific information do you want to graph? Select the specific question you want to graph.
When you are finished making changes, click Update Graph, Save & Go to Graph, or Return to Graph.
Once you Add Additional Data to your graph, you’ll see a new option beside your graph for Combine.
By default, this option is set to “Yes,” combining the original data with the additional data for a sum of both in the visualization. Switch this to “No” (and Apply the change) if you would like to see your additional data featured separately on the graph. This is an ideal alternative for line and bar graphs, but not for pie charts.
Add Comparison Graph
Section titled “Add Comparison Graph”You also have the option to add a comparison graph. For instance, if you want to compare Accomplishments from this year to the previous year, you can choose last year’s graph from the Select Comparison Graph dropdown menu and hit Save & Go to Graph. This will return you to the graph display, and you will see both graphs in tandem on the same page.
Note: if you want to compare data within the same graph, use Add Additional Data instead.
Create Graph Template
Section titled “Create Graph Template”During the graph creation process, you may find you periodically build graphs with the same set of criteria, modifying a date range or some other minor adjustment. To help save time during this process, you can create a template from an existing graph.
-
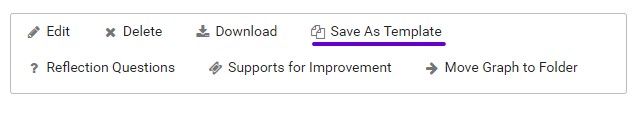
Open the existing graph that you want to use to create a template.
-
Click Save as Template.
-
Your new template graph will be saved in the Manage Templates folder and on the top level of your Graphs section.
Using a Template
Section titled “Using a Template”-
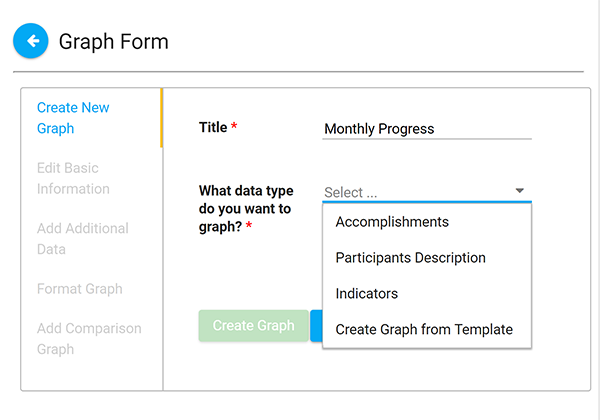
Click on + New Graph.
-
You will see an option under What data type do you want to graph? that says Create Graph from Template.
-
Select the template you wish to use from the dropdown list, then give your new graph a name.
Note: All graphs in your CCB must have unique names. You will receive an error message if you attempt to duplicate a name.
-
Click Create Graph.
-
Modify the date range or any other adjustments you wish to make.