Understanding Indicators
Indicators are objective, population-level measures that can be useful in understanding community trends and assessing the impact of collective community action on longer-term outcomes. Indicators provide broad markers to help assess the impact of your work on longer-term outcomes in your community.
Examples of Indicators
Section titled “Examples of Indicators”- Perceived availability of alcohol by youth
- Employment rates
- Infant mortality rates
- Voter turnout
- Number of low birth-rate babies
- Amount of youth participation
- Violent crime levels
Indicators can be graphed on their own to determine changes in the measure over time, or they can be graphed together with Accomplishments to determine if there is a correlation between the level of Accomplishments and changes in the Indicator. Information from the Indicator database can also be exported into Microsoft Excel for further analysis.
Indicator Overview
Section titled “Indicator Overview”Each Indicator includes several fields for specific information:
-
Category: The category names of your Indicators for helpful grouping.
-
Indicator: The name/title you designate for a specific Indicator (e.g., “Percent of Kansas 10th-graders reporting yes to 30-day use of alcohol in 2018”).
-
Data Source: The source of the data you are entering (e.g., Department of Health & Human Services, U.S. Census, Behavioral Risk Factor Surveillance System, etc.).
-
Initiative: The specific initiative to which the Indicator is related.
-
Topic Area: The topic the Indicator relates to (for example, Health Behaviors, Substance Abuse Prevention, Preventive Care, etc.).
-
Description: Provides more detailed information about the Indicator and what it represents.
-
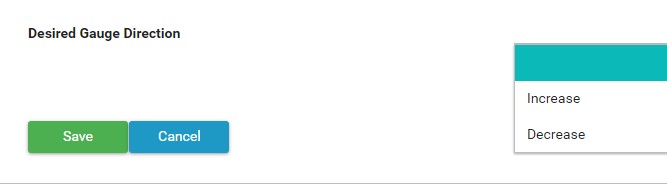
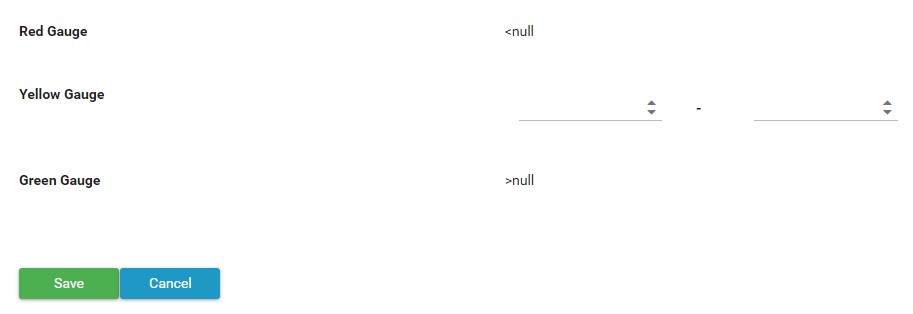
Gauges: You have the option to generate a visual icon (green, yellow, or red) next to your indicator that depicts at a glance whether the numbers are on a favorable or unfavorable trajectory overall.
- Green indicates favorable results
- Yellow indicates a minimal amount of change (or neutral)
- Red indicates an unfavorable trajectory
When setting up your gauge, you determine what the neutral (yellow) range will be and whether or not an increase or decrease is desired. Anything “greater than” the desired number entered in your neutral range will be green. Anything “less than” will be red.
-
Geographic Level: This allows you to identify a geographic level: City, State, Zip Code, County, or Census Tract. You can also enter a specific location/address. In addition, you have the option to add a custom level (such as “country”), if the Indicator is not taking place in one of the established options.
These fields will always be included in the Indicator, and individual projects also have the option of adding five additional fields that are customized to the information they would like to collect.