Managing Indicators (Admin)
Admin Only: Setting up an Indicator is an Owner/Admin function.
Indicators are objective, population-level, numerical measures that can be useful in understanding community trends and assessing the impact of collective community action on longer-term outcomes.
Indicator Overview
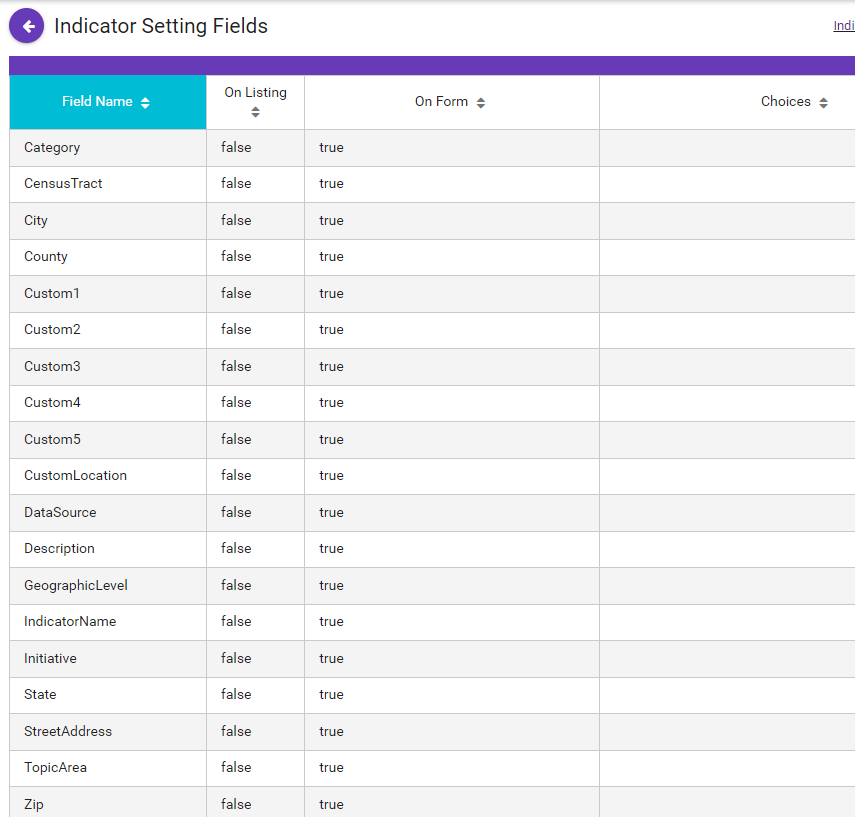
Section titled “Indicator Overview”Each Indicator includes several fields:
-
Category: An optional field for manual entry but required for batch imports. Often mirrors the Topic Area.
-
Data Source: The source of the data (e.g., Dept. of Health and Human Services, U.S. Census, etc.).
-
Indicator Name: The specific title of the Indicator.
-
Description: A brief sentence or two providing more detail.
-
Topic Area: The category the Indicator relates to (e.g., Health Behaviors, Substance Abuse Prevention, etc.).
-
Initiative: The specific initiative to which the Indicator is related.
-
Geographic Level: Optional field for City, State, Zip Code, County, or Census Tract. You can also create a custom geographic level.
Note: If you include Geographic Level, you are then required to list all potential choices for that level.
Before You Start
Section titled “Before You Start”- You must set up an Indicator first in the Administration section before data is uploaded or entered manually.
- Make sure all potential dropdown options are available for Category, Data Source, Topic Area, Initiative, and Geographic Level.
- The Indicator Name and Description are text fields (write-ins), so they shouldn’t have prepopulated choices.
- If importing data, the text used for Indicator Name and Description must match exactly for each data instance.
- Instructions for entering Indicator data can be found here, including a downloadable template.
Setting Up Your Choices
Section titled “Setting Up Your Choices”-
Under the Administration section of your CCB, click on Indicators.
-
If no Indicators have been set up yet, you will see a blank table.
-
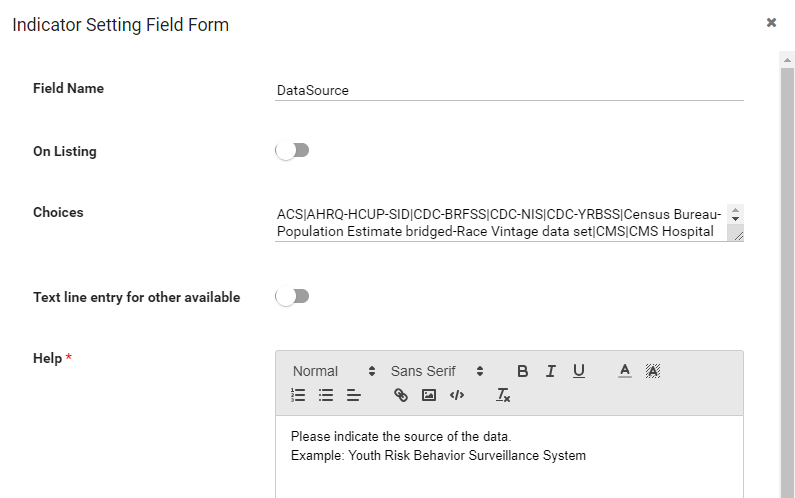
Click on any of the Field Names (such as DataSource) to get a popup where you can enter all potential choices.
Note: It is not recommended that you enable “Text line entry for other available,” since you will not be able to graph those text entries.
-
Separate each choice by using the pipe ”|” character.
Note: Be sure there are no spaces on either side of your pipe. Also be sure there is no pipe character at the end of your list of choices.
-
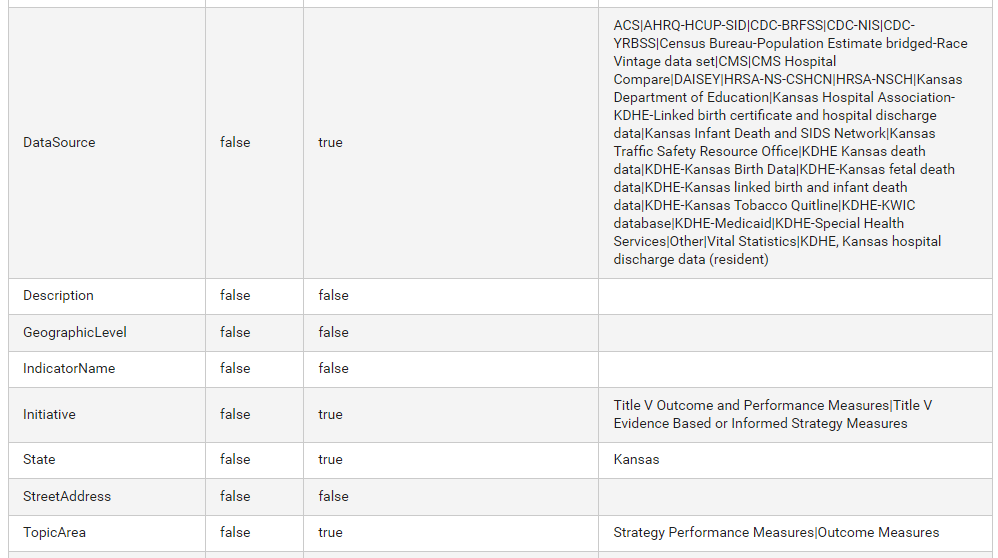
When finished, your table should look something like this:
Completing the Indicator Data Import
Section titled “Completing the Indicator Data Import”-
Once you have your data with the headers in a saved Excel doc, it is ready for import. Download an Excel template here, if needed.
-
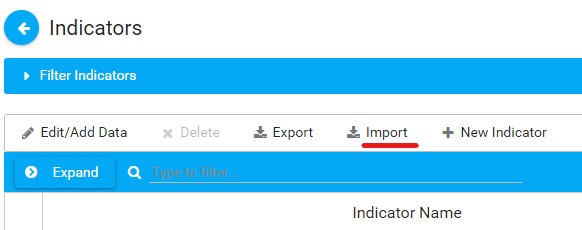
In the upper (non-Administrative) section of the sidebar, click on Indicators.
-
Click the Import button in the menu bar.
-
Choose the Excel file from your computer and upload it.
-
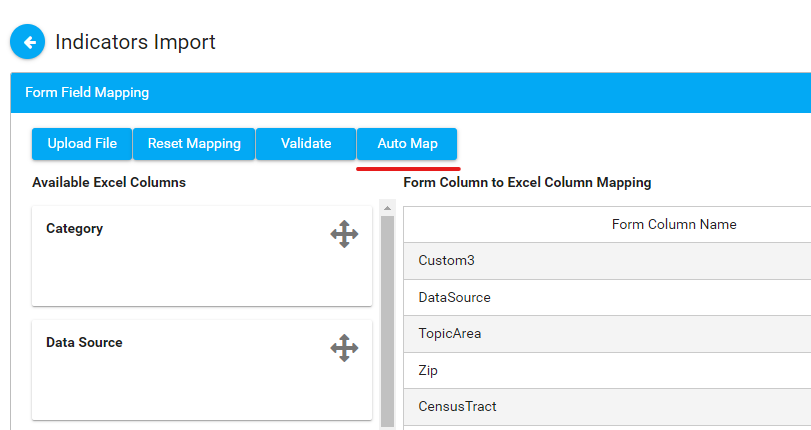
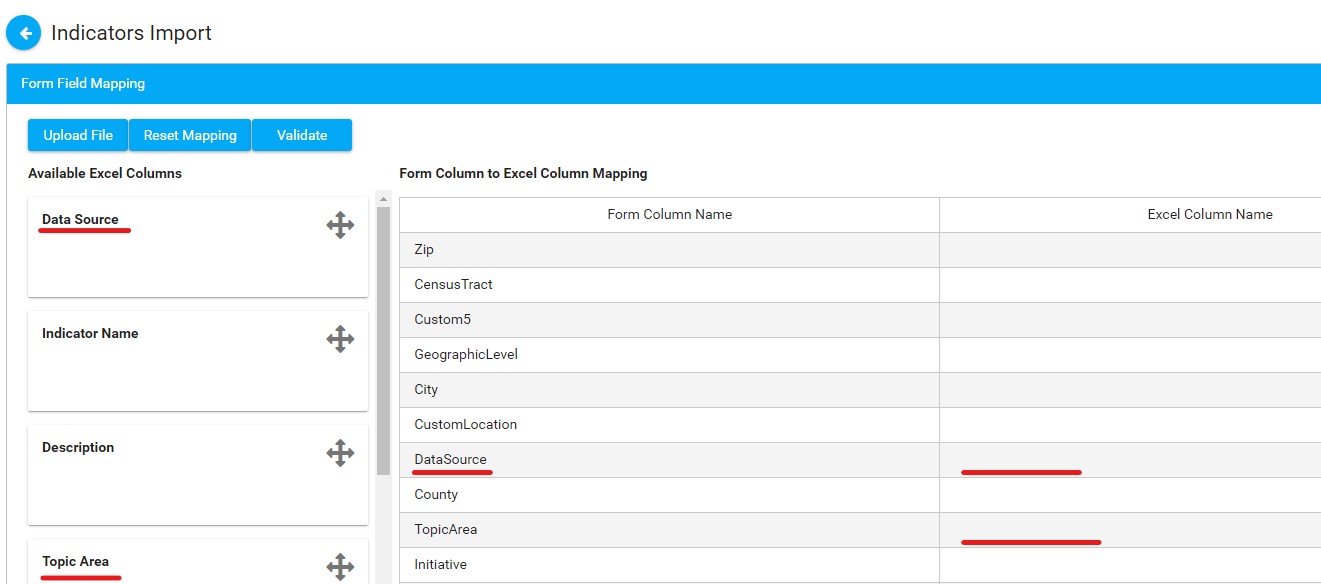
You’ll see the Form Field Mapping interface. Click on Auto Map first, which will automatically map most fields.
-
Drag and drop any remaining fields from the left column to the corresponding fields on the right.
-
Once mapping is complete, click Validate. If there are any errors, correct them. If not, click Upload File. You should see an “Import Successful” prompt.
Administration Section: Indicators
Section titled “Administration Section: Indicators”This is where you create options for Indicators and view existing Indicator options.
- Go to Administration > Indicators.
- Click on a field name to open a popup.
- Slide any toggles to the right for On Listing if you want that field to display on the Indicator listing.
- In Choices, enter the responses for that field, separated by a pipe (”|”) for each potential response.
- Toggle the Text line entry for other available to the right if you want to add that option.
- Add any Help text.
- Click Save. Repeat as needed.